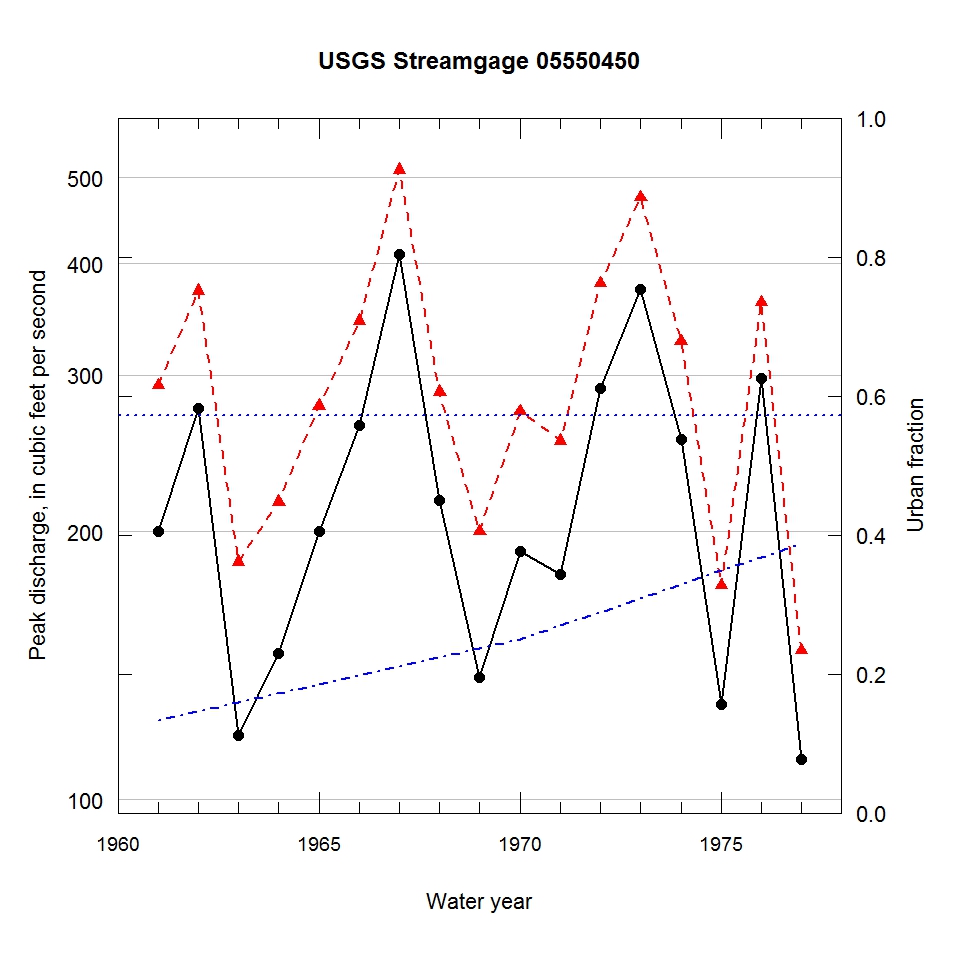
Observed and urbanization-adjusted annual maximum peak discharge and associated urban fraction and precipitation values at USGS streamgage:
05550450 POPLAR CREEK NEAR ONTARIOVILLE, IL


| Water year | Segment | Discharge code | Cumulative reservoir storage (acre-feet) | Urban fraction | Precipitation (inches) | Observed peak discharge (ft3/s) | Adjusted peak discharge (ft3/s) | Exceedance probability |
| 1961 | 1 | -- | 633 | 0.133 | 1.282 | 200 | 292 | 0.452 |
| 1962 | 1 | -- | 633 | 0.146 | 0.270 | 275 | 373 | 0.247 |
| 1963 | 1 | -- | 633 | 0.159 | 1.738 | 118 | 185 | 0.792 |
| 1964 | 1 | -- | 633 | 0.172 | 3.149 | 146 | 216 | 0.700 |
| 1965 | 1 | -- | 633 | 0.185 | 0.579 | 200 | 277 | 0.495 |
| 1966 | 1 | -- | 633 | 0.198 | 0.533 | 263 | 345 | 0.309 |
| 1967 | 1 | -- | 633 | 0.211 | 1.215 | 410 | 510 | 0.093 |
| 1968 | 1 | 2 | 633 | 0.224 | 3.270 | 217 | 287 | 0.467 |
| 1969 | 0 | -- | 1154 | 0.237 | 2.081 | 137 | 200 | 0.750 |
| 1970 | 2 | -- | 1154 | 0.250 | 2.400 | 190 | 273 | 0.510 |
| 1971 | 2 | -- | 1154 | 0.270 | 0.235 | 179 | 253 | 0.576 |
| 1972 | 2 | -- | 1154 | 0.289 | 0.662 | 290 | 380 | 0.234 |
| 1973 | 2 | -- | 1154 | 0.309 | 1.830 | 374 | 475 | 0.122 |
| 1974 | 2 | -- | 1154 | 0.329 | 0.957 | 254 | 327 | 0.354 |
| 1975 | 2 | -- | 1154 | 0.348 | 0.643 | 128 | 174 | 0.822 |
| 1976 | 2 | -- | 1154 | 0.368 | 1.640 | 297 | 362 | 0.268 |
| 1977 | 2 | -- | 1154 | 0.388 | 1.350 | 111 | 147 | 0.890 |

